Overview
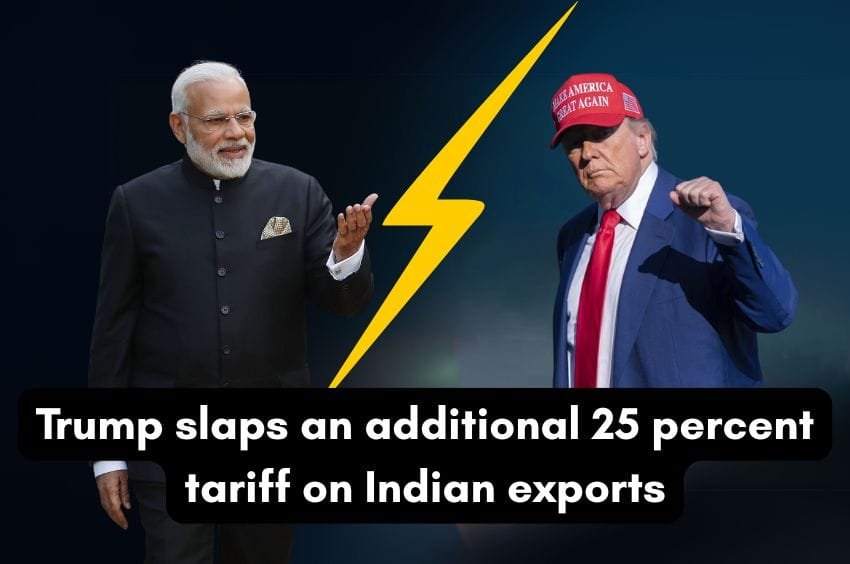
While the US-China trade war opened up the “China+1” opportunity, India’s advantage might be fading. Former President Donald Trump’s proposal to levy 25% tariffs on Indian goods-mirroring those on China-could derail India’s export momentum, especially to the US, which has been a top trading partner.
India may now face a severely disadvantageous position, not just against China but also against other China+1 beneficiaries like Vietnam, Bangladesh, and Mexico.
The Shift in US Import Share
The US has significantly reduced its dependency on China over the years. However, the gains haven’t gone predominantly to India.
US Goods Imports (% Share of Total Imports)
| Country | 2016 Share | 2024 Share | Change |
|---|---|---|---|
| China | 21.0% | 9.5% | -11.5% |
| India | 2.1% | 3.2% | +1.1% |
| Vietnam | 1.9% | 5.0% | +3.1% |
| Mexico | 13.3% | 15.0% | +1.7% |
| Canada | 12.6% | 11.2% | -1.4% |
Source: US Census Bureau, Moneycontrol Research
While India’s exports to the US grew, its share is modest compared to Vietnam or Mexico.
What New Tariffs Mean for India
US Tariff Comparison
| Country | Tariff Rate (Estimated Post-Policy) |
|---|---|
| India | 25% |
| China | 25% |
| Vietnam | 5-10% (with trade agreements) |
| Mexico | 0-5% (USMCA benefits) |
| Bangladesh | 10-12% |
With a 25% penalty, India loses its competitive pricing advantage, now standing shoulder to shoulder with China in tariff impact-without the same scale or infrastructure.
Challenges in Finding Alternate Markets
Why shifting $20B in exports is not easy:
- US accounts for ~20% of India’s exports (~$86B).
- If reduced to 15%, India needs to reallocate ~$20B elsewhere.
- That’s 45% more than India exports to China or the UK each.
- Double the size of Indian exports to Germany.
- ~60% of India’s total exports to ASEAN.
Diversification Hurdles:
- Demand stagnation in non-US markets (like the EU).
- Stiff competition from countries with trade agreements (Vietnam, Mexico).
- Local demand in these regions isn’t as strong or resilient as the US.
China Still Grows Despite US Restrictions
Even as China’s trade with the US shrank, its global export share grew, particularly in Asia and Europe.
China’s Export Growth (CAGR, 2017-2024)
| Region | Growth Rate |
|---|---|
| ASEAN | 11% |
| European Union | 7% |
India must now compete with both China and the US in these regions.
Case Study: Chemicals Export to EU
- The US already contributes 11% to EU chemical imports.
- China’s share is higher, at 15%.
- India’s exports are growing but still face fierce rivalry.
EU Chemical Import Breakdown
| Country | Share of EU Imports |
|---|---|
| China | 15% |
| US | 11% |
| India | ~6-7% (estimated) |
India sends 29% of its organic chemical exports to the EU. Any further increase faces scalability and pricing challenges.
Case Study: Textile Sector in EU (HS Code 61)
- India’s share in EU textile imports is just 3%-flat over the last 10 years.
- Vietnam and Bangladesh have grown significantly and now, with China, make up 38% of EU’s textile imports.
EU Textile Import Share (Category: HS Code 61)
| Country | Share |
|---|---|
| China | 18%+ |
| Vietnam | 10%+ |
| Bangladesh | 10%+ |
| India | 3% |
India already exports 40% of its textiles in this category to the EU. Room for growth exists but will require substantial effort, pricing flexibility, and trade agreements.
Growth Prospects: US vs EU
| Metric | US | EU |
|---|---|---|
| Growth Resilience | High | Moderate |
| Discretionary Demand | Strong | Weak |
| Trade Agreement Favor | Low (India) | Improving (negotiations) |
The US remains a growth engine. Losing ground there means Indian exporters must work harder in weaker demand zones like the EU.
Conclusion
India’s opportunity as a China-plus-one exporter is at risk. Tariff parity with China, weak global demand, and entrenched competition from trade-agreement beneficiaries create a perfect storm.
Indian exporters face:
- A need to re-strategize
- Pressure to innovate and diversify
- Long-term policy support and FTAs
Without these, replacing the US market will be an uphill battle.
